A large proportion of wind turbine sites are surrounded by obstacles which provide shelter:good for many living things but not so good for wind turbines.
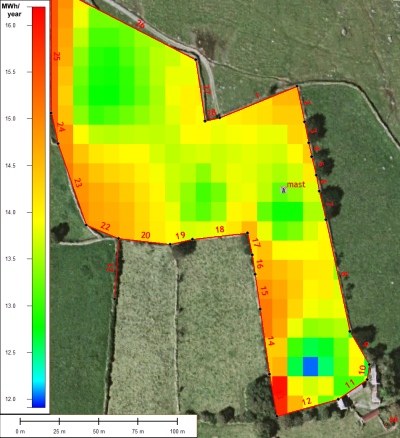
ShelterMap
Wind Measurement International has developed in-house software, ShelterMap, to implement peer revived wind shade models in a cost effective procedure, allowing rapid calibration using on-site shear data. The software runs in conjunction with WindFarm superimposing onto the landform laminar flow and accounting for the long term windrose measured for your site.
The result is an energy map across your site, at a range of heights, of the 10 year average annual energy production of your preferred wind turbines. The results quantify discussions with planning authorities and allow a balanced view to be taken on energy yield versus visual impact.
Accurate shelter analysis allows the data from smaller met masts to be extrapolated upwards with minimum uncertainty, allowing prediction of the energy yield from turbines with hub heights greater than mast height.
Shelter Effects
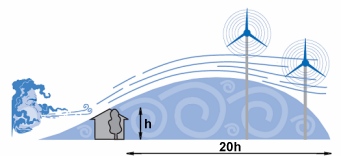
A common type of figure depicting shelter effects is shown to the right. The figure can be misleading since it indicates that there is minimal effect at distances more than 20 times the obstacle's height. What it is actually saying is the turbulence, not the shelter, is minimal at these distances.
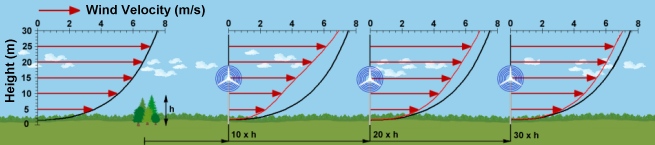
Peer reviewed models are available to predict the wind shelter effects of trees, buildings and hedges. The figure below provides an example of such a case where the undisturbed wind speed at 12 m above ground level is 5.5 m/s.
There is a lot of information in the above figure, so we will take it one step at a time.
First look at the left hand 'wind speed profile' (Insert on left). The wind is blowing from left to right. Moving up from ground level, the profile shows that initially wind speed rapidly increases with height. However, there are diminishing returns the higher and higher you go. The length of the red arrows indicate the strength of the wind at different heights.
The trees, height h, provide an obstacle to the wind. In this particular example the trees have a porosity of 0.3. A high porosity close to 1 means that the tree has virtually no leaves and the branches are not dense. A porosity close to 0.3 relates to a tree coming into full leaf.
The profiles to the right of the trees are at different distances downwind. The black line describes what the wind speed would be if there were no obstacles. The red line and arrows indicate model results for the case of a 10 m high tree. Numerous studies by both previous workers and Wind Measurement International have shown these model results to be realistic. The model is very similar to that described by the Danish wind industry.
As can be seen, even at a distance of 20 times the obstacle height, there is at least 1 m/s slow down of the wind speed. In terms of annual energy production (and financial return) this is very significant. The other main point to note is that the slow down in wind speed carries on well above the tree height.
Wind Measurement International's twin anemometer met mast allows this profile to be measured and the wind shelter model calibrated. The calibrated model provides the means to predict the wind speeds at heights above the top anemometer and across the proposed site.

 Wind Measurement International has developed in-house software, ShelterMap, to implement peer revived wind shade models in a cost effective procedure, allowing rapid calibration using on-site shear data. The software runs in conjunction with WindFarm superimposing onto the landform laminar flow and accounting for the long term windrose measured for your site.